|
As a passing note ... visualization of the data updated. Incorporated google spreadsheets to make it easier to update the data when new data is available, and to make it so multi0year data could be quickly assessed. But google spreadsheets don't embed well, and are difficult to view on smaller screens. Data has been updated to infographics that should be easy to view and read on any device. Hopefully these changes will make the data more accessible and easier to view and understand!
0 Comments
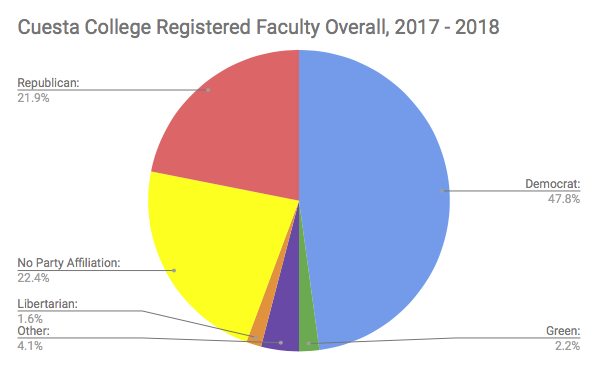
The make-up of faculty at Cal Poly registered to vote was compared to San Luis Obispo County and the City of San Luis Obispo. With the addition of data from Cuesta College, it only seems appropriate to put together some additional comparisons. 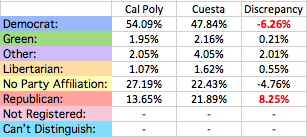 % in each category, among those registered at Cuesta v. Cal Poly % in each category, among those registered at Cuesta v. Cal Poly First, compared to Cal Poly, Cuesta has a greater proportion of Republican faculty by 8.25 percentage points, and a smaller proportion of Democrat faculty by 6.26 percentage points. For the other categories the differences are relatively negligible. In general, for viewpoint diversity, these discrepancies are good. The divide between the proportion of registered faculty who are Democrats at Cal Poly compared to Republican is huge. Cuesta still has an overrepresentation of registered faculty identifying as Democrats, but not to the same extent as Cal Poly.
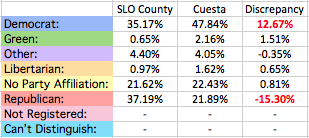 % in each category, among those registered at Cuesta v. SLO County % in each category, among those registered at Cuesta v. SLO County Next, compared to San Luis Obispo County, Cuesta College does a slightly better job reflecting the county than Cal Poly did. But, it still has an overrepresentation of Democrats by 12.67 percentage points, and an underrepresentation of Republicans by 15.3 percentage points. For the other categories the differences are relatively negligible. Community Colleges, at least stereotypically, are expected to be more community oriented, and to better reflect and serve the local community they reside within than large state or private universities may. When it comes to faculty political party registration, Cuesta is on track and doing better than Cal Poly, but it is still out of touch and there is room for much improvement.
Fall 2017 has been update season for Poly Politics. Now included in the list of updates is the addition of Cuesta College data to the site.
Key findings:
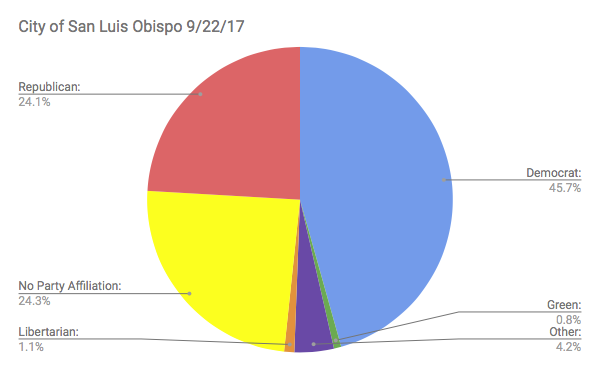
More discussion about the Cuesta College data, in addition to comparisons to other data is forthcoming--check back for blog post(s) this coming week. Also, as a passing thought/comment .... With the addition of Cuesta to the site, the "Poly" in Poly Politics no longer refers to "Cal Poly," but now reflects "Poly" in the more classic sense of the word (i.e., multiple, many) 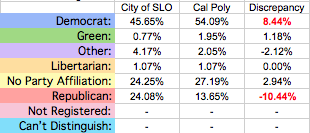 % of registered Cal Poly faculty in each category vs. City of SLO % of registered Cal Poly faculty in each category vs. City of SLO In an earlier post I compared the proportions of faculty registered in each political party category to proportions for the County of San Luis Obispo. To follow up with this I thought it may be interesting to compare Cal Poly to the city of San Luis Obispo--a more immediate point of reference, given that it resides on the edge of the city. And while many Cal Poly faculty do not live within San Luis Obispo, most do. I will focus on the comparison for the proportion of registered voters at Cal Poly compared to those in San Luis Obispo*. The registration report for San Luis Obispo was obtained on 9/22/17**.
Looking at the table and figures, while the discrepancies aren't quite as extreme as they were in the county comparison, they are still present, which I find quite interesting. In San Luis Obispo a plurality of the voters are registered Democrats (though not quite a majority), but there is still a sizable contingency of registered Republicans--24.08%. Even though the city of San Luis Obispo is a key Democratic stronghold for the county, Cal Poly's faculty still have an overrepresentation of Democrats by 8.46 percentage points, and an underrepresentation of Republicans by 10.44 percentage points. While among registered voters in San Luis Obispo the Democrats outnumber the Republicans almost by a ratio of 2:1 (1.896 Democrats for every one Republican), Cal Poly beats them out with a ratio of 4:1 (3.964 Democrats for every one Republican). Even when comparing the political party make-up of Cal Poly's registered faculty to the make-up of San Luis Obispo it is clear that Cal Poly doesn't do a good job reflecting the city. * If I leave in the proportions for Cal Poly faculty in the "not registered" and "can't determine" categories, the numbers and interpretation gets a bit difficult and disconnected.
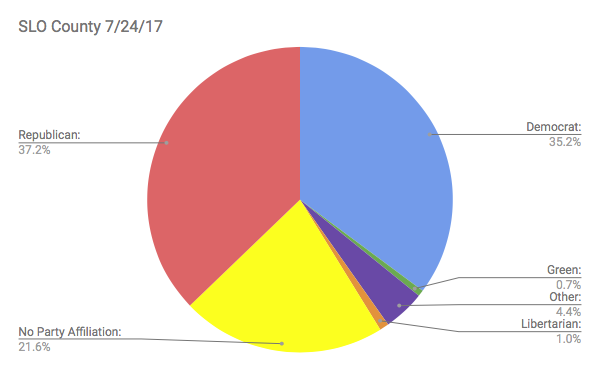
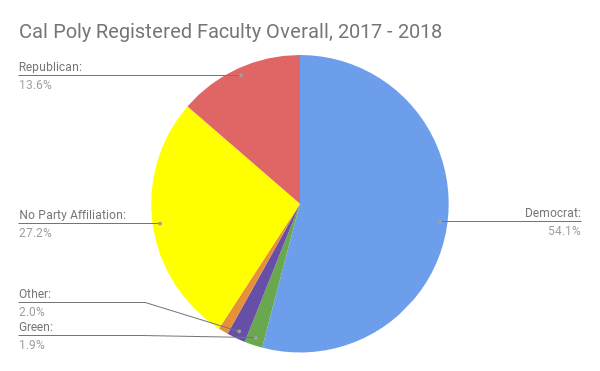
** As of 9/22/17 in the city of San Luis Obispo there were 12,622 registered Democrats, 6658 Republicans, 214 Green, 297 Libertarian, 1152 Other, and 6706 with no party preference. 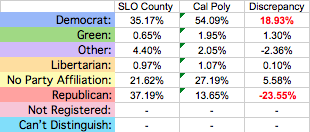 % in each category, among those registered at Cal Poly v. SLO County % in each category, among those registered at Cal Poly v. SLO County How well does the political party make-up of Cal Poly's faculty reflect the make-up of the county within which it resides? As shown in the following tables, it doesn't reflect the county well at all! While a plurality (but not majority) of the 165,607 registered voters in San Luis Obispo County (as of 7/24/17) are Republicans, this is nowhere near the case at Cal Poly. Focusing just on the percentages of faculty who are registered* to vote, the proportion of registered faculty at Cal Poly who are Libertarian, not affiliated with a political party, or who fall into the "other" category don't deviate terribly far from county proportions. But, the proportion of Democrats deviates from that of the county by an increase of 18.93 percentage points, while for Republicans the proportion is under by 23.55 percentage points.
These are not piddly differences in proportions at Cal Poly v. proportions for SLO County. Perhaps it is not entirely surprising, given that this population (i.e., university faculty) tends to be predominantly liberal and predominantly registered as Democrats. In fact, the faculty Democrat to Republican ratio at Cal Poly might actually be much smaller than many or most other universities. But, as the numbers reflect, when it comes to the political party make-up of Cal Poly (given faculty registered to vote), Cal Poly is grossly out of step with the county within which it resides. * Faculty may not be registered for a variety of reasons, including but not limited to: they are not U.S. Citizens, they recently moved to the area and have not registered yet, they are registered at home wherever home may be, or they simply don't care/aren't interested in voting.
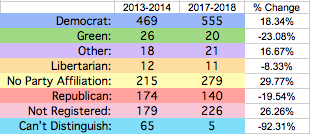 % gain/increase for each category % gain/increase for each category 642017-2018 data on the political party affiliation of Cal Poly faculty is in, and the numbers reveal some interesting trends. Most notably, between 2013-2014 and 2017-2018, there was a 19.54% drop in the number of registered Republicans on campus (a loss of 34 individuals), while other categories received a sizable bump up such as Democrats who increased 18.34% (gain of 86 individuals), No Party Affiliation with 29.77% increase (gain of 64 individuals), and Not Registered with a 26.26% increase (a gain of 47 individuals). 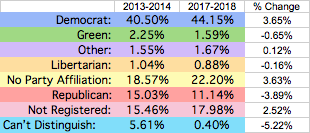 % change in overall make-up of the campus % change in overall make-up of the campus Overall, these changes amounted to Republicans losing 3.89% of the total campus make-up, while Democrats gained 3.65%, No Party Affiliation gained 3.63%, and Not Registered gained 2.52%. The increase in No Party Affiliation seems to conform the national trend of individuals moving away from identifying with the two major political parties. The increase in Not Registered is interesting, as traditionally university faculty are considered to be quite politically active. And post 2016 election, one would have assumed there would have been great interest in voting among faculty. The increase in faculty who are not registered may be a byproduct of an increase in faculty employed at Cal Poly who are not U.S. citizens (i.e., not eligible to vote in U.S. elections), or attributable to a recent increase in new faculty who have not yet registered to vote (they may have never ben registered, may still be registered at their last residence, et cetera). Future data updates will give some insight into this. But, for now my primary interest is in the changes associated with the two major political parties in the U.S. Specifically: "what happened to all of the Republicans??" As one of the two major political parties in the nation, this is a sizable drop for an already small minority faction on campus. A number of things are possible. Those who identified as Republicans in 2013-2014 could have retired, moved, been fired/not re-hired and been replaced with non-Republicans, or could have changed their party registration. Movement in terms of party registration mostly likely would have involved switching to "No Party Affiliation" (motives ranging from wanting to be more discrete about political beliefs, particularly since primaries in CA are open now so it isn't as important to be registered with a particular party, to a lack of alignment with the current stances of the party...but there is no way to know motive looking at numbers). To dig deeper into this, and to explore the possibility that the number of Republicans dropped because they changed their party registration, I went back into my old data files to extract the 174 individuals identifying as Republican in 2013-2014 so I could try and find them in the 2017-2018 data (match between the two data sets). I found the following:
Before discussing these numbers, let me also present numbers from the other direction: starting in 2017-2018 and looking back to 2013-2014:
So, taken together, since 2013-2014 at the university level Cal Poly lost 101 Republicans. 83 were flat out lost (they are no longer employed at Cal Poly), and 18 were lost due to switching their party preference. But, from 2013-2014 to 2017-2018 Cal Poly gained 68 Republicans, 46 who were new hired and 22 who changed their party registration. So, when going back to a possibility I put forward earlier in the post (which I wrote before conducting the calculations), the numbers indicate that changes due to individuals changing their party registration are negligible: 18 switched away from Republican, 22 switched to Republican...these nearly cancel each other out. It appears the main reason accounting for the loss of Republicans is the lack of replacement. At the university level, Cal Poly lost 101 Republicans over this four year period, but only gained 68--only 67.32% of the Republicans that were lost between 2013-2014 and 2017-2018 ended up being replaced by Republicans. And if we look just at the Republican faculty that are gone (83) and the new Republican faculty (46; ... so ignoring those that changed their registration) the percent is even smaller: only 55.42% of outgoing Republicans were replaced with incoming Republicans. Republicans left, possibly because they retired, because they got a new job somewhere else, or because they just weren't hired back (or were fired)*. Why does this matter?? Looking just at this voter registration data and the trends since 2013-2104, it appears faculty are becoming more politically homogeneous. If the low replacement trend for Republicans continues, it seems clear that the number of registered Republicans among the faculty at Cal Poly will continue to shrink--Republicans will continue to become a smaller and smaller numerical minority on campus, and they are already a very small faction! The consequences this may have for teaching, research/scholarly output, collegiality among faculty, and the student experience on campus (particularly for Republican students) are not negligible. * Now, we can't say that 46 of them were directly replaced by Republicans as many other vacancies likely occurred, so they may have replaced Democrats, filled newly created positions, or something else--we're just looking at net changes here. For example, a Republican in the Animal Science department could have retired and an individual who was hired to replace then could have ended up being Republican. Or, a Republican in the Biology department could have retired, and an individual who ended up being Republican could have been hired in the Animal Science department ... point is, I'm looking at macro university level trends, not 1-1 replacement within departments, or even within colleges. I may look at that, but if I do it will be in a later post.
Updated data on Cal Poly faculty is now available. Here are some key findings.
* Note: in a few departments, a factions other than Democrat or Republican have even numbers, or in a few times are even a plurality. But given Democrat-Republican are the two major parties in our electoral system, and are typically the to that are most often compared, ratios for these two are the only presented here Data on Cal Poly's faculty has been officially updated. 2017-2018 data on Cal Poly Faculty is now available.
Key "big picture" take-aways from update:
Forthcoming, a discussion of the trends and notable findings will be posted here on the blog. Poly Politics continues to be a relevant and frequently visited site, but as the site nears its 5th year, a refresh is much needed.
The resulting product of this refresh is a site that I think is brighter, more user-friendly, and presents the data in a much more streamlined manner. I hope you will agree. Data, as you will see (or already have seen) is presented in a slightly different format. In addition to the names of faculty in every department (at the time when the data was collected) and the pie-chart for the department/area, the specific numbers for each category are also enumerated. The use of Google Sheets to display the data will also facilitate easier updates to the data in years to come. Further, using Google Sheets makes it easy to quickly switch between years, to see how the partisan split of individual departments, of colleges, or of the campus overall may change over time. And on the note of updates to the data, with the most recent data coming from the 2013-2014 academic year, it is time for an update! So, also to coincide with the site entering its 5th year, updated data is forthcoming! Expect updated data to be posted by November (I'll post here when everything has been updated). I hope interested individuals will continue to find the data relevant and important. I also hope the data will lead people to pause and consider what it means, particularly as related to viewpoint/intellectual/viewpoint diversity. Enjoy the site! Today Poly Poly Politics was finally launched with updated partisan affiliation data, new data, and a new look.
More updates to come. Enjoy! |
Blog serves as a forum to discuss findings, trends, and implications, as well as to post about updates to the site and/or data.
Author

Nathan Honeycutt
Archives
June 2018
Categories
All
|


 RSS Feed