|
1. Why is there no margin of error?
No margin of error exists because every individual represented in the study was analyzed--the whole population represented (see #4) was analyzed. 2. How did you sample? Is the sample representative? The whole population was analyzed, so the sample is without a doubt representative. The names of each individual sampled can be found on their respective department/division page on this site. Instead of taking a representative sample or individually talking to everyone every name was analyzed in a voter-registration database. 3. What about the people who are not registered to vote? Any individual not registered to vote was marked as "Unknown" and put in that category, and thus are still part of the results of the research. 4. Who was sampled? (Who is represented in this study?) Every individual that has a direct impact on the every-day operation and function of the university was analyzed. This includes faculty, administration, and others (such as auxiliaries, student representatives, etc.) 5. Some names show up on two or more department or division pages, were they counted multiple times? No. Strict measures prevented this from occurring. Each individual that is a part of a department or division was counted toward the overall percentages of that division or department. When it came to doing the overall by-college or area percentages, and the university in sum percentages all duplicates were removed and thus no name was counted more than once. Any other questions please post them as a comment!
4 Comments
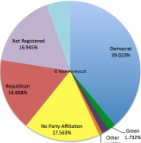
The distribution by party is quite interesting, especially when broken down by college and major. The College of Liberal Arts holds the recognition as being the college with the greatest number of Democrats, and the Smallest number of Republicans, tallying in at 50% and 8.86% respectively. The College of Agriculture, Food, and Environmental Sciences holds the recognition as having the greatest percentage of Republicans among all of the colleges (28.92%), and is also distinguished in that it has the most even proportions among parties of all the colleges (28.92% D, 28.92% R, 18.67% NP, 22.29% Unk.). When it comes to being most neutral, the College of Engineering tops the list with its 21.26% stronghold of individuals registered with no party affiliation.
Majors/Departments are a whole different story. Some special distinctions:
Hundreds of hours, and a few months later, that which I thought at one point to be a 'neat idea' but not really attainable has finally gone live. I'm cuttin' it close too. With the election being only five days away there couldn't have been a better time for this information to become available. My hope is that this information will provide a greater insight to an aspect of Cal Poly, SLO that is often considered a 'taboo' topic, and will in turn generate a lively and civil campus discussion. Maybe it will bring those affiliated with Cal Poly as students, faculty, or administration to pause and think about what the numbers present--especially what they may present when analyzed longitudinally. Let the numbers speak for themselves! -- N8
|
Blog serves as a forum to discuss findings, trends, and implications, as well as to post about updates to the site and/or data.
Author

Nathan Honeycutt
Archives
June 2018
Categories
All
|
 RSS Feed