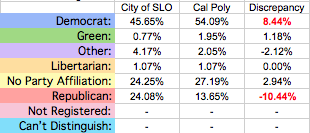
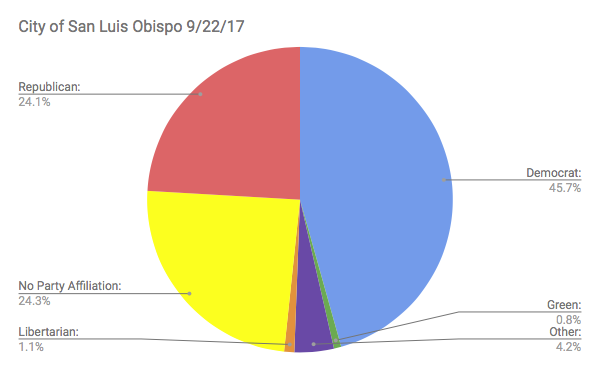
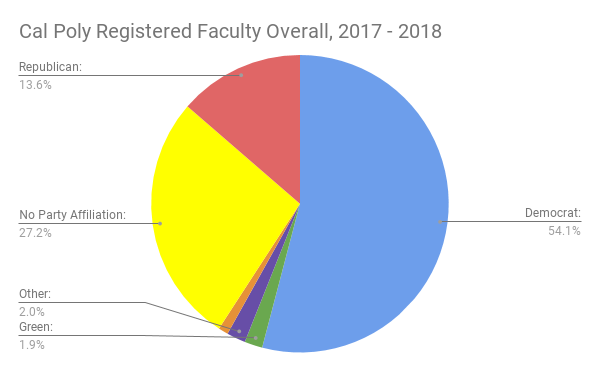
 % of registered Cal Poly faculty in each category vs. City of SLO % of registered Cal Poly faculty in each category vs. City of SLO In an earlier post I compared the proportions of faculty registered in each political party category to proportions for the County of San Luis Obispo. To follow up with this I thought it may be interesting to compare Cal Poly to the city of San Luis Obispo--a more immediate point of reference, given that it resides on the edge of the city. And while many Cal Poly faculty do not live within San Luis Obispo, most do. I will focus on the comparison for the proportion of registered voters at Cal Poly compared to those in San Luis Obispo*. The registration report for San Luis Obispo was obtained on 9/22/17**.
Looking at the table and figures, while the discrepancies aren't quite as extreme as they were in the county comparison, they are still present, which I find quite interesting. In San Luis Obispo a plurality of the voters are registered Democrats (though not quite a majority), but there is still a sizable contingency of registered Republicans--24.08%. Even though the city of San Luis Obispo is a key Democratic stronghold for the county, Cal Poly's faculty still have an overrepresentation of Democrats by 8.46 percentage points, and an underrepresentation of Republicans by 10.44 percentage points. While among registered voters in San Luis Obispo the Democrats outnumber the Republicans almost by a ratio of 2:1 (1.896 Democrats for every one Republican), Cal Poly beats them out with a ratio of 4:1 (3.964 Democrats for every one Republican). Even when comparing the political party make-up of Cal Poly's registered faculty to the make-up of San Luis Obispo it is clear that Cal Poly doesn't do a good job reflecting the city. * If I leave in the proportions for Cal Poly faculty in the "not registered" and "can't determine" categories, the numbers and interpretation gets a bit difficult and disconnected.
** As of 9/22/17 in the city of San Luis Obispo there were 12,622 registered Democrats, 6658 Republicans, 214 Green, 297 Libertarian, 1152 Other, and 6706 with no party preference.
0 Comments
Your comment will be posted after it is approved.
Leave a Reply. |
Blog serves as a forum to discuss findings, trends, and implications, as well as to post about updates to the site and/or data.
Author

Nathan Honeycutt
Archives
June 2018
Categories
All
|
 RSS Feed