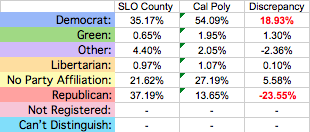
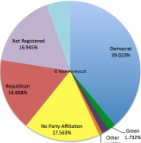
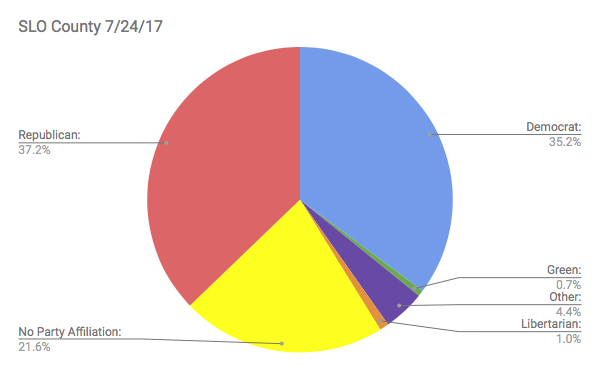
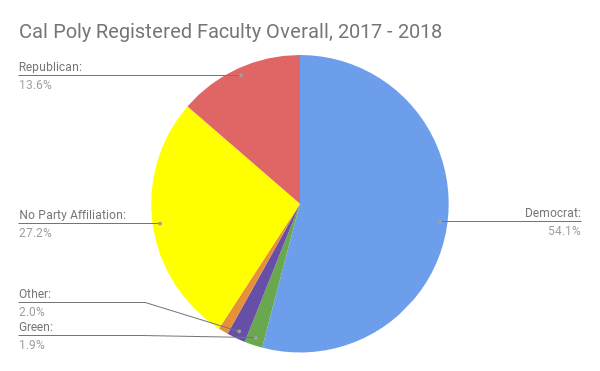
 % in each category, among those registered at Cal Poly v. SLO County % in each category, among those registered at Cal Poly v. SLO County How well does the political party make-up of Cal Poly's faculty reflect the make-up of the county within which it resides? As shown in the following tables, it doesn't reflect the county well at all! While a plurality (but not majority) of the 165,607 registered voters in San Luis Obispo County (as of 7/24/17) are Republicans, this is nowhere near the case at Cal Poly. Focusing just on the percentages of faculty who are registered* to vote, the proportion of registered faculty at Cal Poly who are Libertarian, not affiliated with a political party, or who fall into the "other" category don't deviate terribly far from county proportions. But, the proportion of Democrats deviates from that of the county by an increase of 18.93 percentage points, while for Republicans the proportion is under by 23.55 percentage points.
These are not piddly differences in proportions at Cal Poly v. proportions for SLO County. Perhaps it is not entirely surprising, given that this population (i.e., university faculty) tends to be predominantly liberal and predominantly registered as Democrats. In fact, the faculty Democrat to Republican ratio at Cal Poly might actually be much smaller than many or most other universities. But, as the numbers reflect, when it comes to the political party make-up of Cal Poly (given faculty registered to vote), Cal Poly is grossly out of step with the county within which it resides. * Faculty may not be registered for a variety of reasons, including but not limited to: they are not U.S. Citizens, they recently moved to the area and have not registered yet, they are registered at home wherever home may be, or they simply don't care/aren't interested in voting.
0 Comments
Your comment will be posted after it is approved.
Leave a Reply. |
Blog serves as a forum to discuss findings, trends, and implications, as well as to post about updates to the site and/or data.
Author

Nathan Honeycutt
Archives
June 2018
Categories
All
|
 RSS Feed