Poly Politics
  • About
  • Partisan Split Data
    • Cal Poly, SLO >
      • Campus Overall
      • Administration
      • Agriculture, Food, & Environmental Sciences
      • Architecture & Environmental Design
      • Business
      • Engineering
      • Liberal Arts
      • Science & Mathematics
    • Cuesta College
  • Blog
  • Contact
    • Reference Info

Poly Politics Blog

Key Findings from 2017-2018 Data

9/25/2017

0 Comments

 
Updated data on Cal Poly faculty is now available. Here are some key findings.

  • The Republican to Democrat ratio for faculty now sits at 1 : 3.96 ; at the university level, there are about 4 registered Democrat professors for every 1 registered Republican professor. In 2013-2014 this ratio was about 1:2.70
    • In CAFES this ratio is 1:1.5 (1:0.83 in 2013-2014)
    • In CAED this ratio is 1:3.92 (1:3.07 in 2013-2014)
    • In OCOB this ratio is 1:2.8 (1:2.07 in 2013-2014)
    • In CENG this ratio is 1:3 (1:2.15 in 2013-2014)
    • In CLA this ratio is 1:7.07 (1:5.74 in 2013-2014)
    • In COSAM this ratio is 1:5.2 (1:3.59 in 2013-2014)
 
  • Of the 54 departments at Cal Poly: 
    • Democrats compromise a majority (i.e., 50% or more) in 20
    • Democrats comprise a plurality (i.e., are the largest faction, but not a majority) in 17
    • Republicans comprise a majority in 1
    • Republicans comprise a plurality in 2
    • No Republicans exist in 11 
 
  • Excluding the 11 departments where there are zero Republicans, the departments with the largest Republican to Democrat ratios are*:
    1. English with 1:20.5 (1:8 in 2013-2014)
    2. Chemistry with 1:18 (1:6.17 in 2013-2014)
    3. History with 1:15 (1:16 in 2013-2014)
    4. Architecture with 1:15 (1:11 in 2013-2014)
    5. Physics with 1:7.67 (1:9 in 2013-2014)
    6. Art and Design with 1:7.5 (1:9 in 2013-2014)
    7. Biology with 1:6.67 (1:5 in 2013-2014)
 
  • The departments with the lowest Republican to Democrat ratios are*:
    1. Ag Ed. and Comms with 1:0.25 (5:0 in 2013-2014)
    2. BRAE with 1:0.33 (1:0.36 in 2013-2014)
    3. Animal Science with 1:0.44 (1:0.10 in 2013-2014)
    4. Wine and Viticulture with 1:1 (1:0.50 in 2013-2014)
    5. Architectural Engineering with 1:1 (1:1.33 in 2013-2014)
    6. Horticulture and Crop Science with 1:1.25 (1:1.5 in 2013-2014)
    7. Construction Management with 1:1.67 (1:0.75 in 2013-2014)
    8. Accounting with 1:1.67 (1:2.4 in 2013-2014)
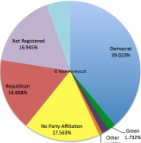
* Note: in a few departments, a factions other than Democrat or Republican have even numbers, or in a few times are even a plurality. But given Democrat-Republican are the two major parties in our electoral system, and are typically the to that are most often compared, ratios for these two are the only presented here
0 Comments

Your comment will be posted after it is approved.


Leave a Reply.

    Blog serves as a forum to discuss findings, trends, and implications, as well as to post about updates to the site and/or data.
    Picture

    Author

    Picture
    Nathan Honeycutt

    Archives

    June 2018
    October 2017
    September 2017
    January 2014
    November 2013
    July 2013
    November 2012
    October 2012
    August 2012

    Categories

    All
    Background Info
    Cal Poly
    Cuesta College
    Discussion Of Data
    Key Findings
    Update Announcement

    RSS Feed

Poly Politics: San Luis Obispo, CA

© 2012 - 2024 Nathan Honeycutt. All Rights Reserved.
The information on this site is available for personal, research, & educational purposes. Any other use is likely unacceptable, unprofessional, and could be subject to criminal penalties. Please visit the Reference Info page for details regarding the use & publishing of aggregate information available on this site.
  • About
  • Partisan Split Data
    • Cal Poly, SLO >
      • Campus Overall
      • Administration
      • Agriculture, Food, & Environmental Sciences
      • Architecture & Environmental Design
      • Business
      • Engineering
      • Liberal Arts
      • Science & Mathematics
    • Cuesta College
  • Blog
  • Contact
    • Reference Info