|
1. Why is there no margin of error?
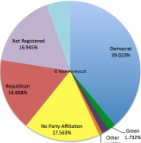
No margin of error exists because every individual represented in the study was analyzed--the whole population represented (see #4) was analyzed. 2. How did you sample? Is the sample representative? The whole population was analyzed, so the sample is without a doubt representative. The names of each individual sampled can be found on their respective department/division page on this site. Instead of taking a representative sample or individually talking to everyone every name was analyzed in a voter-registration database. 3. What about the people who are not registered to vote? Any individual not registered to vote was marked as "Unknown" and put in that category, and thus are still part of the results of the research. 4. Who was sampled? (Who is represented in this study?) Every individual that has a direct impact on the every-day operation and function of the university was analyzed. This includes faculty, administration, and others (such as auxiliaries, student representatives, etc.) 5. Some names show up on two or more department or division pages, were they counted multiple times? No. Strict measures prevented this from occurring. Each individual that is a part of a department or division was counted toward the overall percentages of that division or department. When it came to doing the overall by-college or area percentages, and the university in sum percentages all duplicates were removed and thus no name was counted more than once. Any other questions please post them as a comment!
4 Comments
Jessica
11/4/2012 07:18:33 am
What does "the whole population was analyzed" mean? Does this survey only involve those who have a "direct impact" on university functions, ie faculty/staff/ASI? Do I have a "direct impact" as a student? Are these statistics about the student population or administrative population, because I certainly didn't hear anything about this as just an average joe student. If it's only student government that was sampled, we're assuming that ASI government is actually representative and not just whoever could afford to print enough posters/had interest in ASI enough to run, and that's a pretty big assumption to make.
Nate
11/4/2012 09:46:15 am
Hi Jessica. Great questions. The longer the site is up, the more I am realizing that I need to clarify things better! The study only involves those that have a direct impact on university functions (such as faculty in teaching, admin in running the university and providing services to students, ASI in providing services to students, and student government in representing students). Though as students we do have a "impact" on the university, we could be better described as participants. We came to Cal Poly primarily to get an education, and though we have some control over that, this study reflects the political affiliation data of those that have the primary control of what our education and educational experience at Cal Poly looks like. Those represented in this study reflect those that essentially "call the shots" and "run the show." This study does not reflect the political affiliation data of the student body. I hope this helps! Thanks for participating in the conversation.
Cameron
2/5/2013 02:41:17 pm
I assume you got the list of individuals for each department/office from Cal Poly's public website. Where did you get the information on party registration from? Is that public information with the County Registrar of Voters?
Nate
2/11/2013 06:38:18 am
Hi, Cameron. Your comment will be posted after it is approved.
Leave a Reply. |
Blog serves as a forum to discuss findings, trends, and implications, as well as to post about updates to the site and/or data.
Author

Nathan Honeycutt
Archives
June 2018
Categories
All
|
 RSS Feed